How are heat maps used predictively for safety?
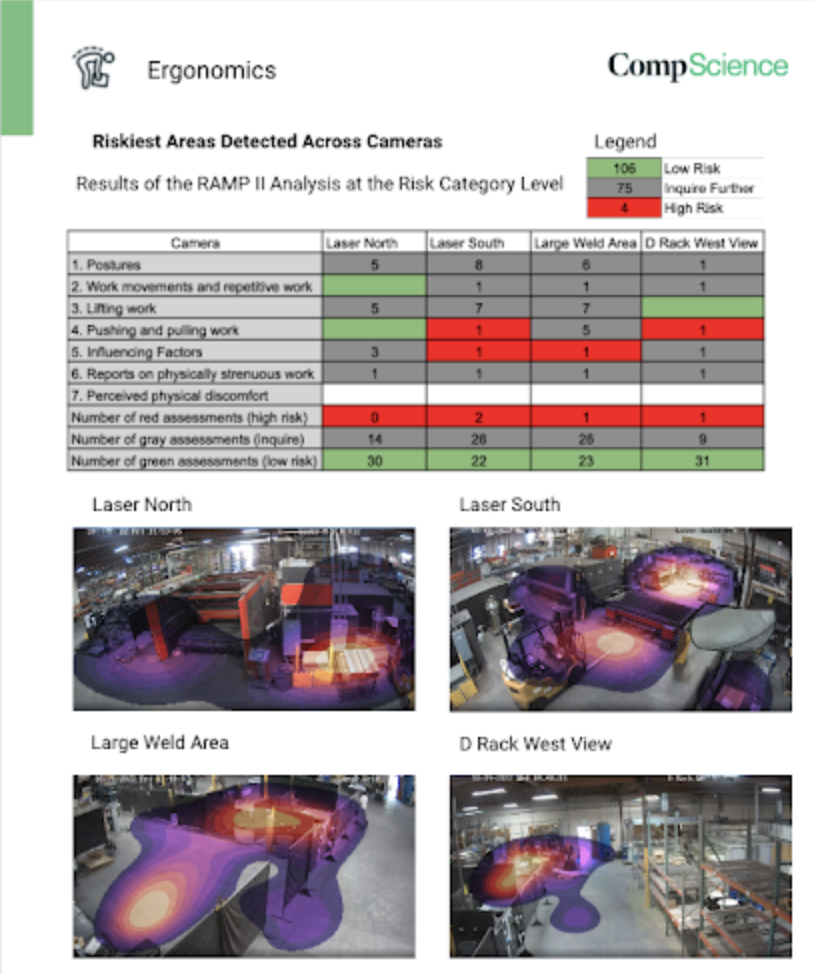
Heat maps are a powerful tool for predicting safety risks by providing a visual representation of data. They are often used to analyze and predict potential safety hazards in various settings, such as workplaces, cities, and transportation systems.
Here are some examples of how heat maps are used predictively for safety:
- Workplace safety: Heat maps can be used to identify areas in a workplace that are at a higher risk of accidents or injuries. By analyzing past incidents and near-misses, safety professionals can create a heat map that shows the areas that have the highest frequency of incidents. This can help managers and safety professionals take proactive measures to reduce the risk of accidents and injuries.
- City planning: Heat maps can be used to identify areas in a city that have a higher risk of accidents or crime. For example, a heat map of traffic accidents can be created to identify intersections or streets that have a higher incidence of accidents. This can help city planners and policymakers make decisions about road design and traffic flow to reduce the risk of accidents.
- Transportation safety: Heat maps can be used to predict potential safety risks in transportation systems. For example, a heat map of airline flight paths can be created to identify areas that have a higher risk of turbulence or other weather-related hazards. This can help pilots and air traffic controllers make decisions about flight paths to reduce the risk of accidents.
Overall, heat maps can provide valuable insights into potential safety risks by visually representing data and identifying areas of higher risk. By using heat maps to predict safety risks, safety professionals can take proactive measures to reduce the risk of accidents and injuries.
Learn more about using Heat Maps for Safety.

